IID Data and Metrics

| Incident Type | 2021 Count | 2022 Count | 2023 Count | 2024 Count | 2025 Count | 2026 Count |
|---|
Shootings
| 4 | 11 | 7 | 10 | 13 | 1 |
|---|
| Fatal vehicle incidents | 2 | 7 | 7 | 8 | 6 | 1 |
|---|
| In-custody deaths | 1 | 2 | 1 | 4 | 2 | |
|---|
| Use of Force | 0 | 0 | 1 | 0 | 0 | |
|---|
Last Updated: 1/30/2026
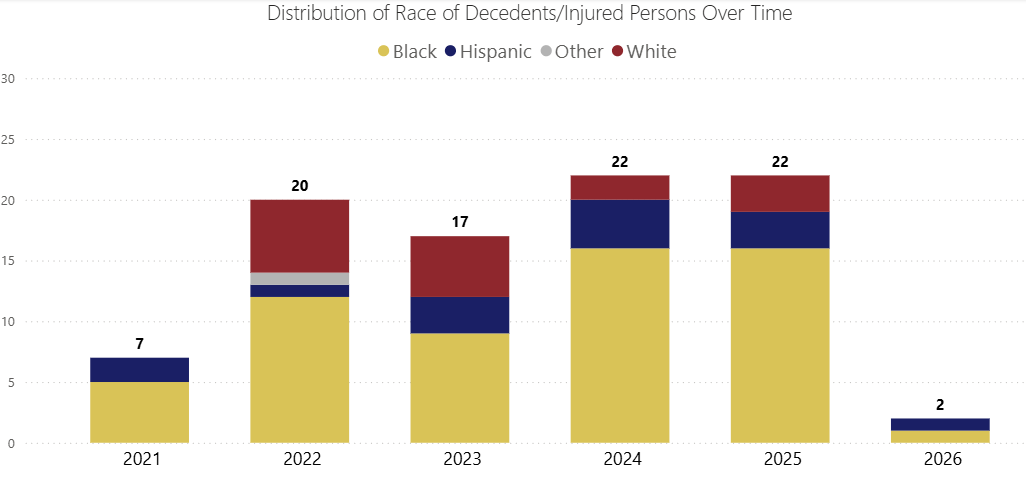
| Race of Decedents | 2021 Count | 2022 Count | 2023 Count | 2024 Count | 2025 Count | 2026 Count |
|---|
| Black | 5 | 12 | 9 | 16 | 16 | 1 |
|---|
| Hispanic | 2 | 1 | 3 | 4 | 3 | 1 |
|---|
| White | 0 | 6 | 5 | 2 | 3 | |
|---|
| Other | 0 | 1 | 0 | 0 | 0 | |
|---|
Last Updated: 1/30/20256
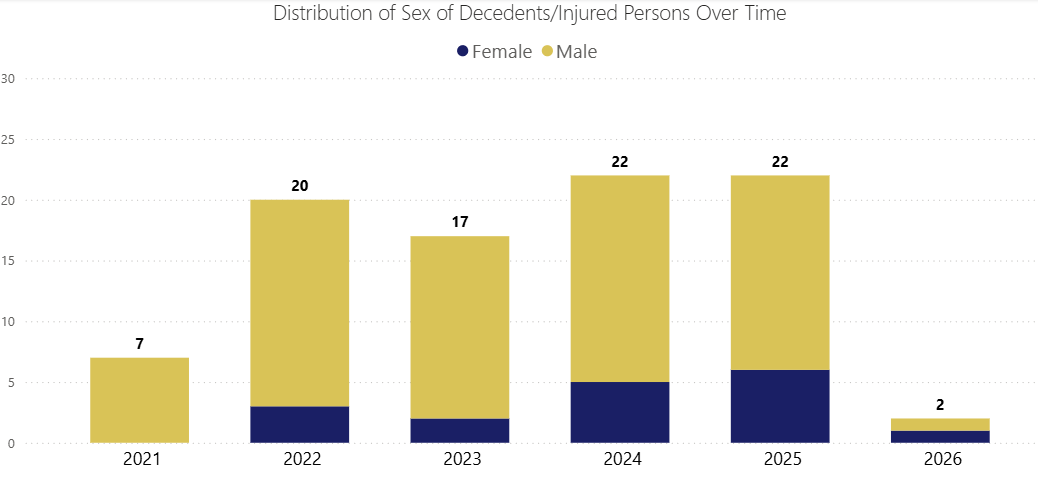
| Sex of Decedents | 2021 Count | 2022 Count | 2023 Count | 2024 Count | 2025 Count | 2026 Count |
|---|
| Male | 7 | 17 | 15 | 17 | 16 | 1 |
|---|
| Female | 0 | 3 | 2 | 5 | 6 | 1 |
|---|
Last Updated: 1/30/2026
Investigations Map
The map below shows the police-involved incidents that IID has investigated and where they have occurred. Locations are annonymized to the block-level. Click the markers for more information on each incident. This map is updated quarterly and may not include investigations where the specific location has not yet been released by IID.
Green – Shootings
Orange – In-Custody Deaths
Blue – Fatal Vehicle Incidents
Purple – Use of Force
Page Content
